1つの期間、両方のアカウント
スコアカードのどの数値も同じ期間を対象にしているので、常に同じ条件どうしの比較になります。期間を変えると、両方が同時に切り替わります。
自分のアカウントを他の誰かと並べられます。同じ期間のフォロワー、いいね、リポスト、返信、ブロック、エンゲージメントスコアでどちらが優勢かがわかります。スプレッドシートも、2つのタブを開いて目を凝らす必要もありません。
比較を始める
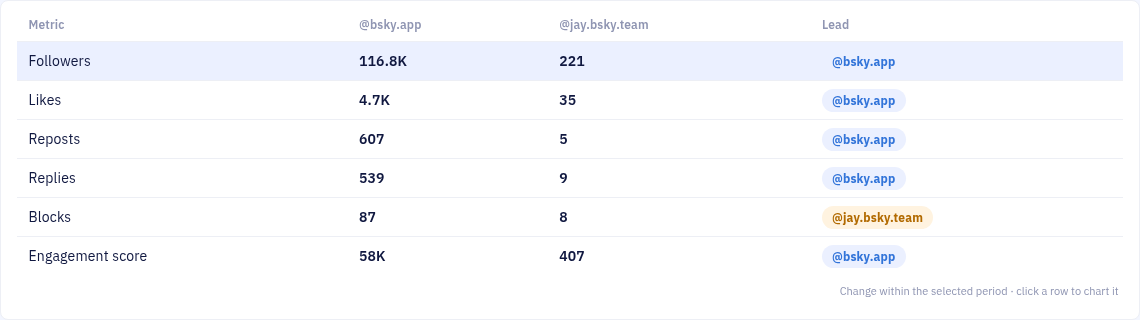
スコアカードのどの数値も同じ期間を対象にしているので、常に同じ条件どうしの比較になります。期間を変えると、両方が同時に切り替わります。
エンゲージメントスコアは、いいね、リポスト、返信に重みをつけ、ブロックを差し引きます。反応を集めるより炎上を招くアカウントは、量だけでは上位になりません。
合計を見れば、どちらが優勢かがわかります。行をクリックすると両方のアカウントが期間全体のグラフになり、いつ差がついたかがわかります。1本のバズった投稿と、着実な成長は、まったく違って見えます。
はい、GraphTracks は任意の2つの Bluesky アカウントを、同じ期間のフォロワー、いいね、リポスト、返信、ブロック、エンゲージメントスコアで並べ、各項目でどちらがリードしているかを示します。
フォロワー、いいね、リポスト、返信、ブロック、そして加重エンゲージメントスコアです。ブロックはアカウントにとってマイナスとして数えます。比較で評価されるのは単なる量ではなく、本当に望ましいエンゲージメントです。
いいえ、ご自身のアカウントを、公開されている任意の Bluesky アカウントと比較できます。ご自身の Bluesky アカウントを接続した GraphTracks アカウントが必要です。比較は Pro プランに含まれており、無料トライアルでも利用できます。
はい、スコアカードの行をクリックすると、GraphTracks が選択した期間の両アカウントを1つのグラフに描きます。最終的な合計だけでなく、どこで差がついたかも確認できます。
